Abstract
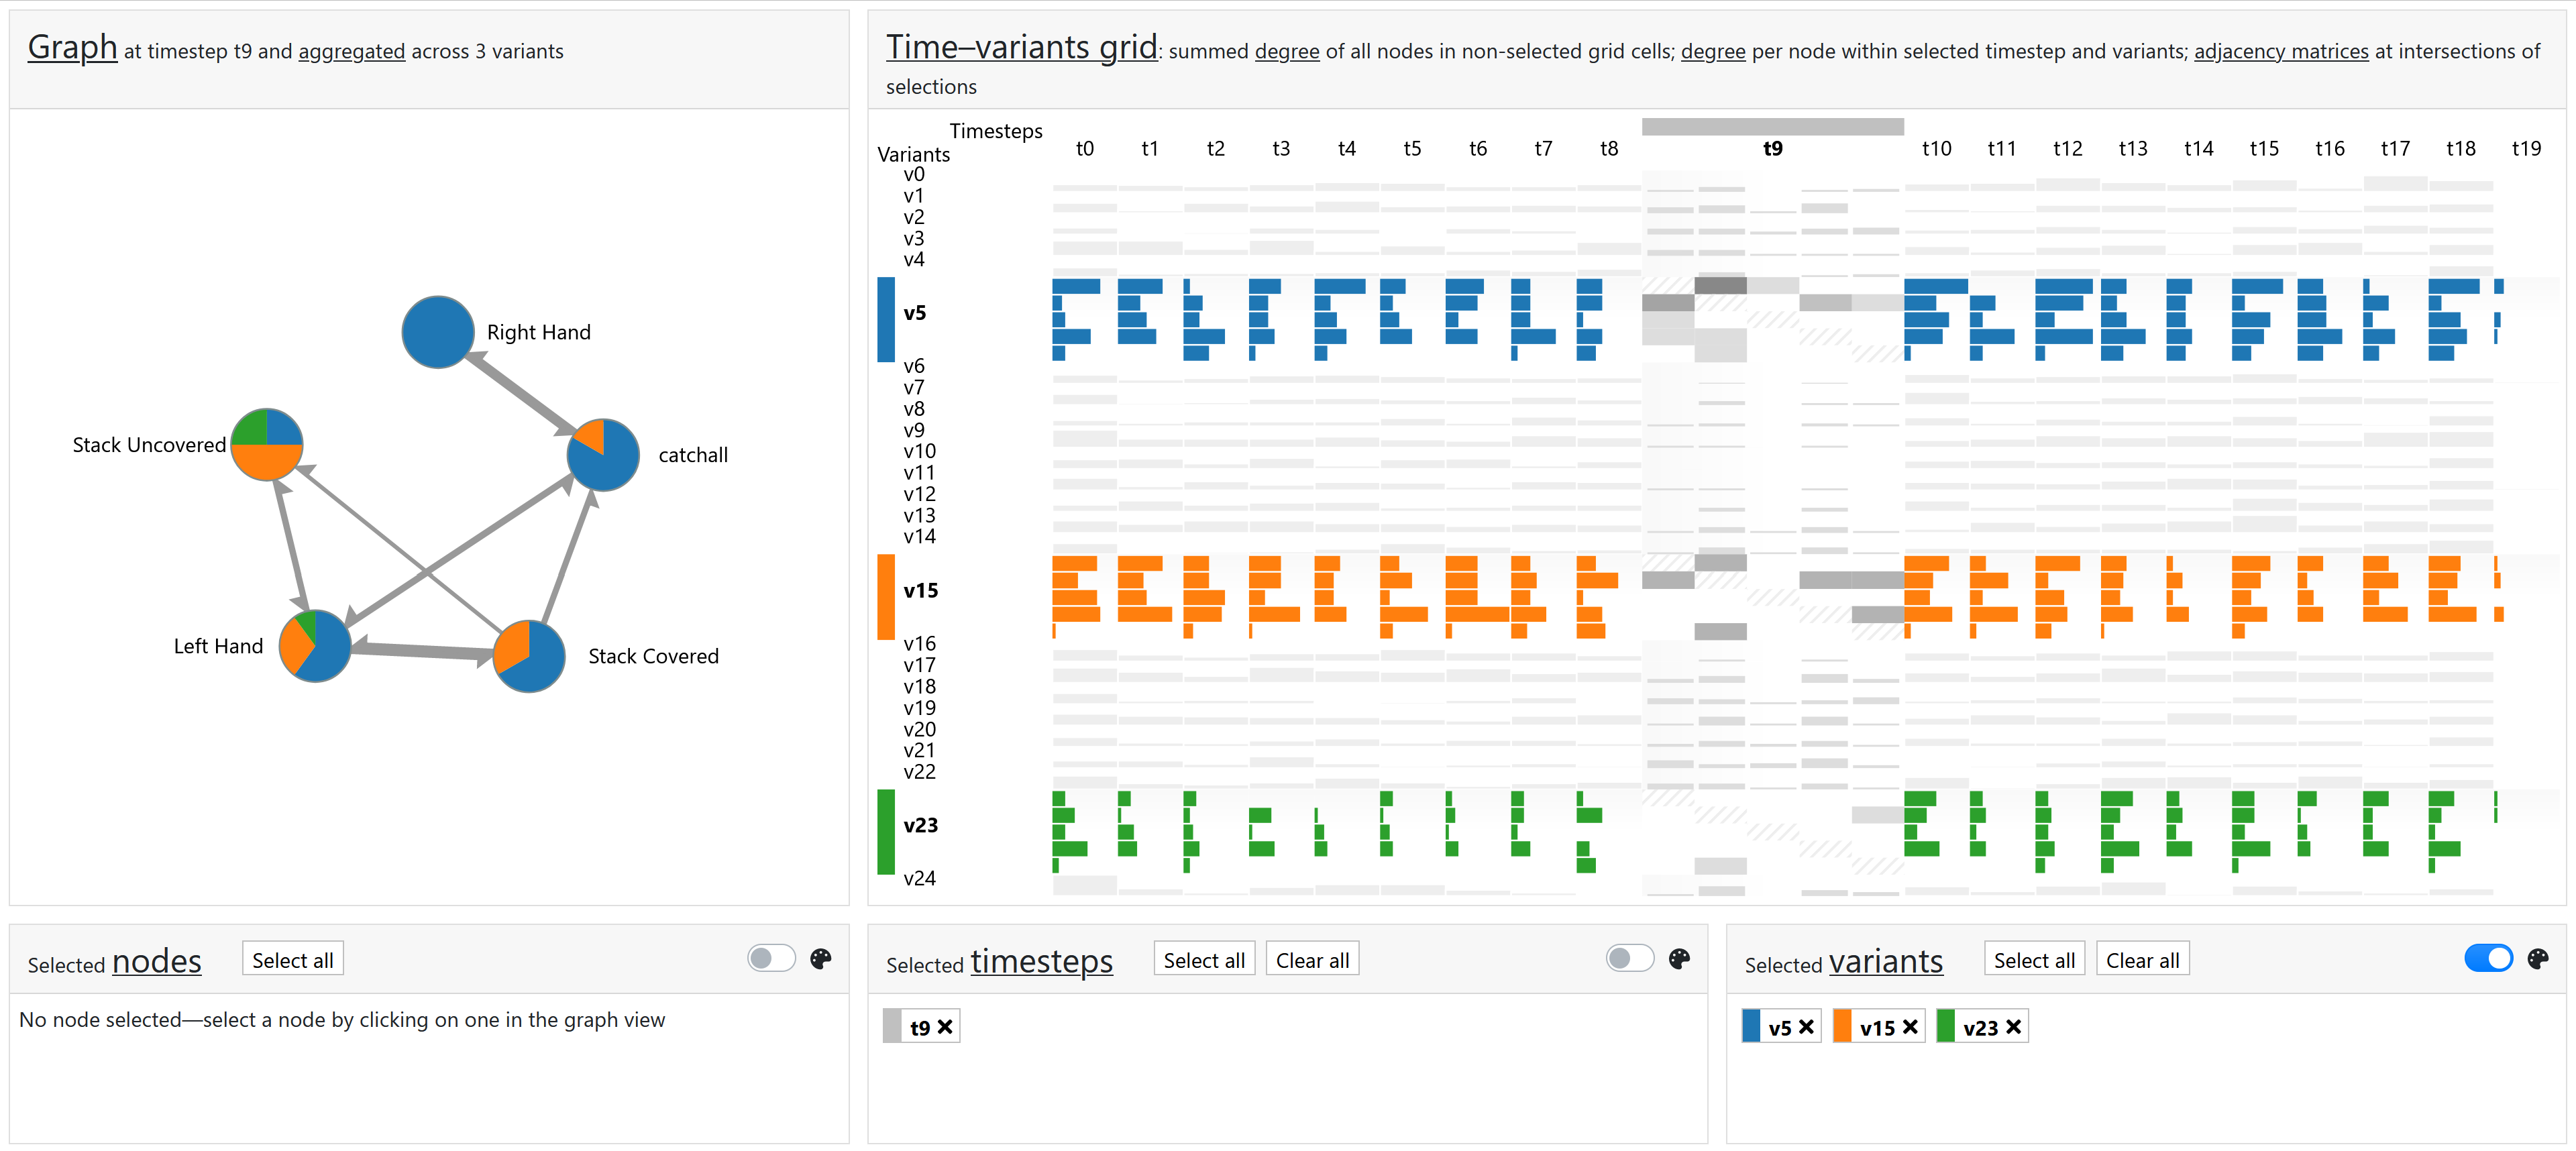
Visualizing dynamic graphs can explain how relationships between objects evolve over time. We generalize this to visually comparing variants of evolving relationships of the same set of objects. Our visualization is based on a tabular representation that shows time on one axis and different dynamic graph variants on the second axis. The option to set multiple focus points in the table supports exploration of graph details. Node-link diagrams are used for an aggregated overview while adjacency matrices show the individual graph details in selected table cells.
Preprint
Exploring a Multi-focus Visual Comparison of Dynamic Graphs
Interactive Prototype
Currently there are four datasets available:
- Memory
-
Data gathered with an Eye Tracker observing a two-player round of
Memory.
Open Memory dataset. - Uno
-
Data gathered with an Eye Tracker observing a two-player round of
Uno.
Open Uno dataset. - Pommerman
-
Data gathered from observing four AIs taking part in the
Pommerman
Challenge.
Open Pommerman dataset. - Twittor
-
A TOR based anonymity preserving message board platform.
Open Twittor dataset.